VPP/g2
Contents
Introduction
G2 is a fine-grained event-log viewer. It's highly scalable, supporting O(1e7 events) and O(1e3 discrete display "tracks"). G2 displays binary data generated by the vppinfra "elog.[ch]" logger component. G2 also supports for the CPEL file format, described here.
Usage
$ cd build-root
$ make g2-install
$ ./install-native/g2/bin/g2 --help
g2 [--ticks-per-us <value>][--cpel-input <filename>] [--clib-input <filename]>
G2 (x86_64 GNU/Linux) major version 3.0
Built Wed Feb  3 10:58:12 EST 2016
When viewing a ".cpel" file, use "g2 --cpel <filename>". When viewing a vppinfra event log, use "g2 --clib <filename>".
Setting Display Preferences
The file $HOMEDIR/.g2 contains display preferences, which can be overridden. Simply un-comment one of the stanzas shown below, or experiment as desired.
/*
 * Property / parameter settings for G2
 *
 * Setting for a 1024x768 display:
 * event_selector_lines=20
 * drawbox_height=800
 * drawbox_width=600
 *
 * new mac w/ no monitor:
 * event_selector_lines=20
 * drawbox_height=1200
 * drawbox_width=700
 *
 * 1600x1200:
 * drawbox_width=1200
 * drawbox_height=1000
 * event_selector_lines=25
 *
 * for making screenshots on a Macbook Pro
 * drawbox_width=1200
 * drawbox_height=600
 * event_selector_lines=20
 */
Screen Taxonomy
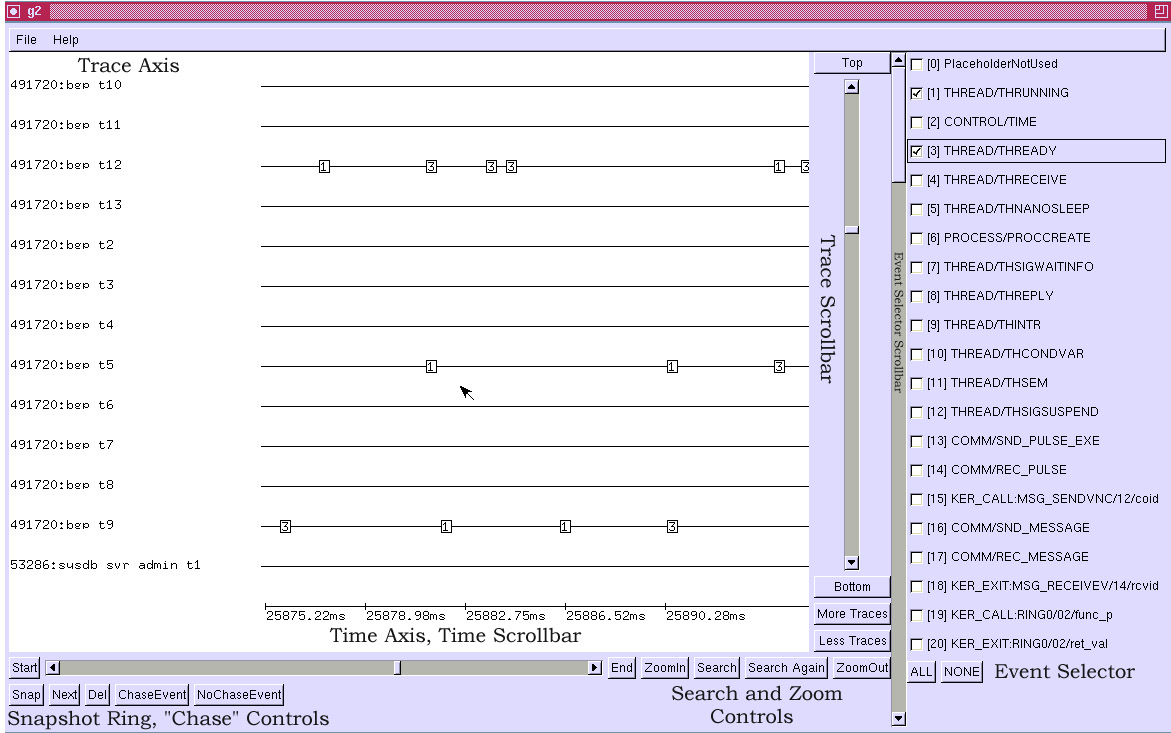
Here is an annotated G2 viewer screenshot, corresponding to activity during BGP prefix download. These data were captured on a Cisco IOS-XR system:
The viewer has two main scrollbars: the horizontal axis scrollbar shifts the main drawing area in time; the vertical axis changes the set of visible process traces. The zoomin / zoomout operators change the time scale.
The event selector PolyCheckMenu changes the set of displayed events.
Using these tools -- and considerable patience -- one can make sense of a given event log.
Mouse Gestures
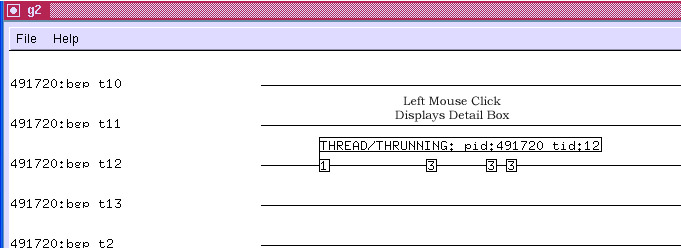
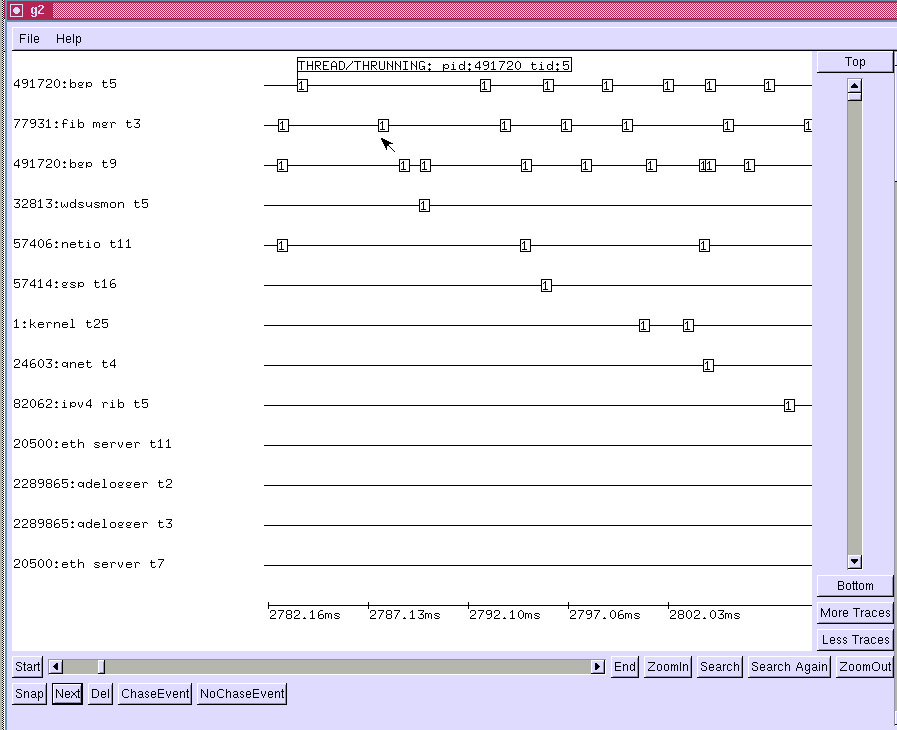
G2 has three fairly sophisticated mouse gesture interfaces which are worth describing in detail. First, left mouse clicking on a display event pops up a per-event detail box:
A left mouse click on an event detail box takes it down.
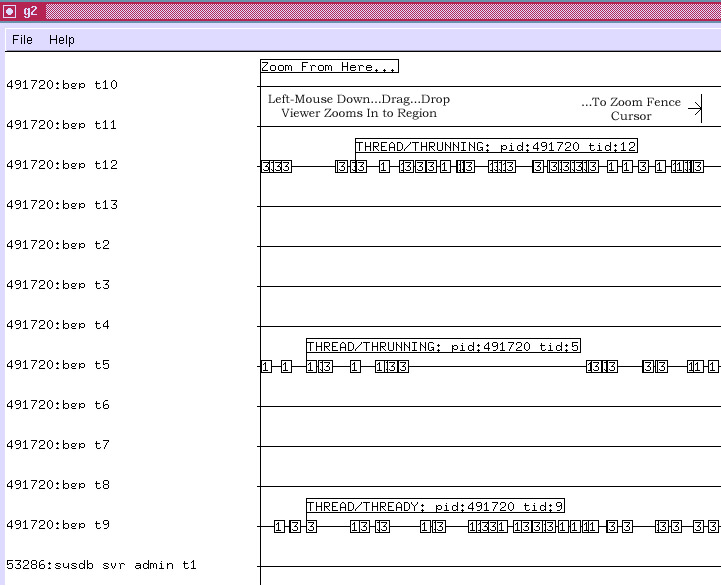
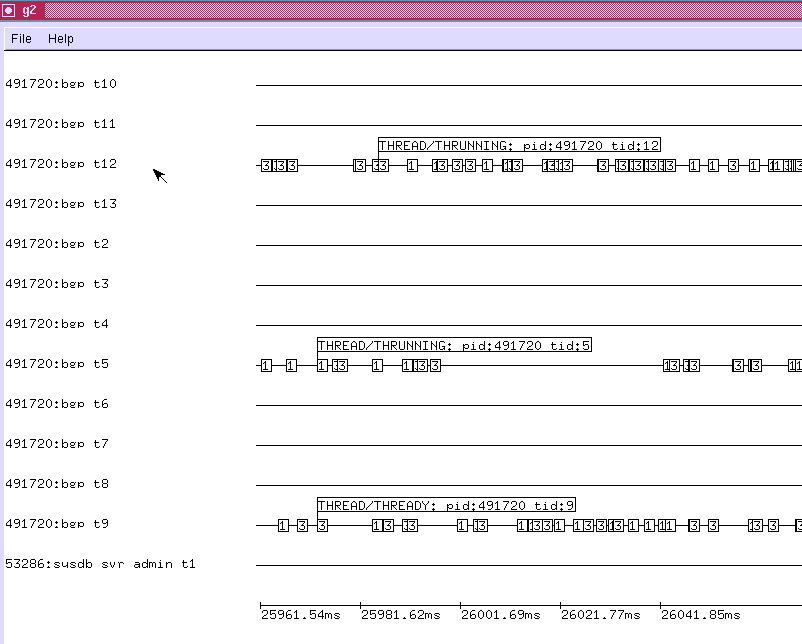
To zoom to a region of the display, press and hold the left mouse button; drag right or left until the zoom-fence pair appears.
When the zoom operation completes, the display is as follows:
Time Ruler
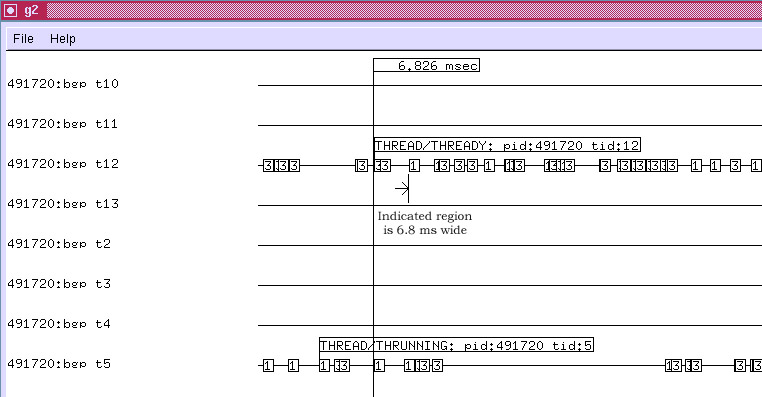
To use a time ruler, press and hold the right mouse button; drag right or left until the ruler measures the region of interest. If the time axis scale is coarse, event boxes can have significant width in time, so use a "reference point" in each event box when using the time ruler.
Event Selection
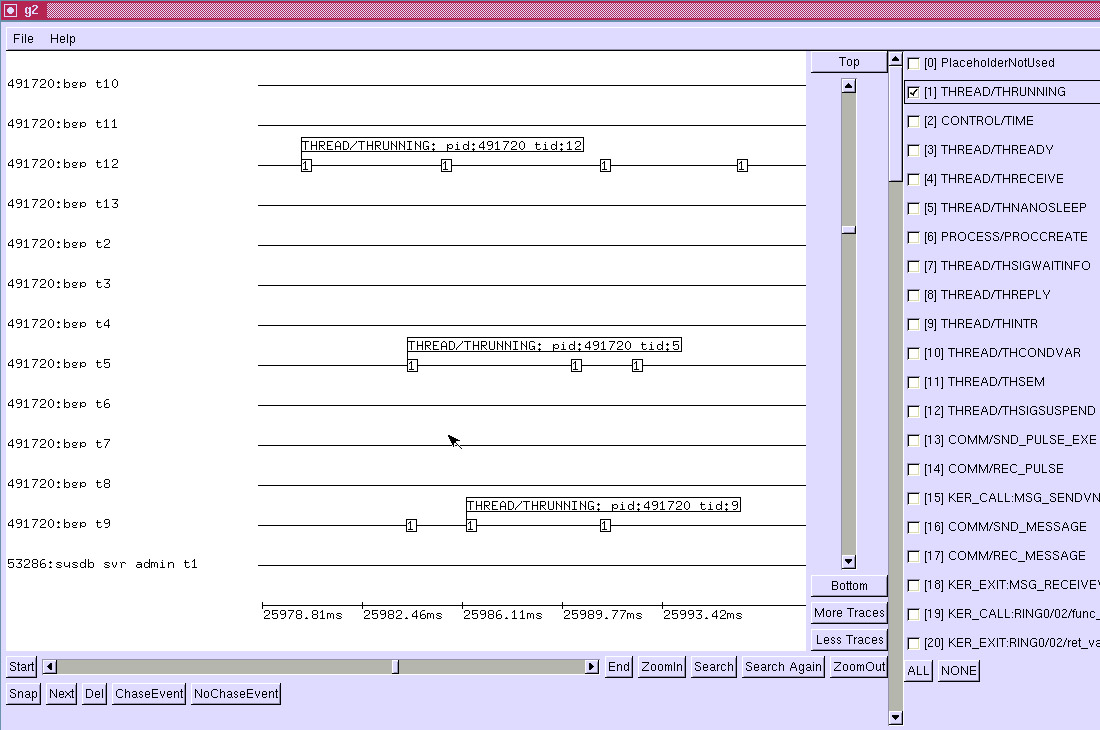
Changing the Event Selector setup controls the set of points displayed in an obvious way. Here, we suppress all events except "this thread is now running on the CPU":
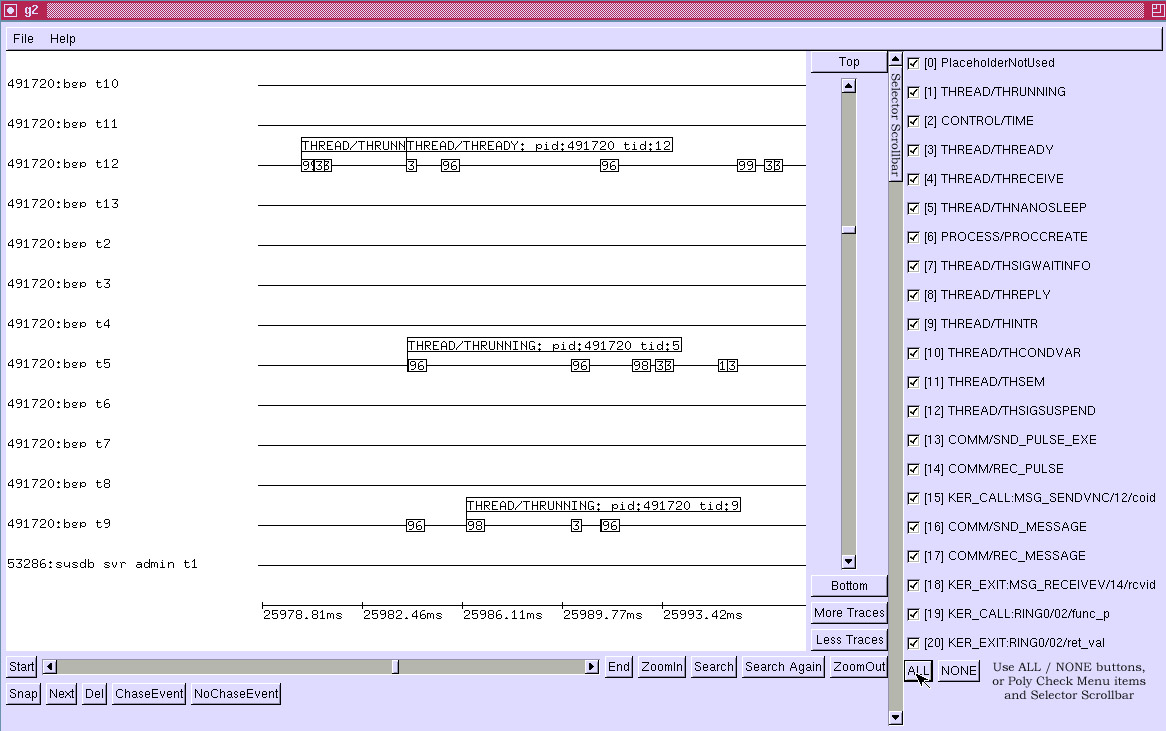
Same setup, with all events displayed:
Note that event detail boxes previously shown, but suppressed due to deselection of the event code will reappear when one reselects the event code. In the example above, the "THREAD/THREADY pid:491720 tid:12" detail box appears in this fashion.
Snapshot Ring
Three buttons in lower left-hand corner of the g2 main window control the snapshot ring. Snapshots are simply saved views: maneuver the viewer into an "interesting" configuration, then press the "Snap" button to add a snapshot to the ring.
The "Next" button restores the next available snapshot. The "Del" button deletes the current snapshot.
See the hotkey section below for access to a quick and dirty method to save and restore the snapshot ring. Eventually we may add a safe/portable/supported mechanism to save/restore the snapshot ring from CPEL and vppinfra event log files.
Chasing Events
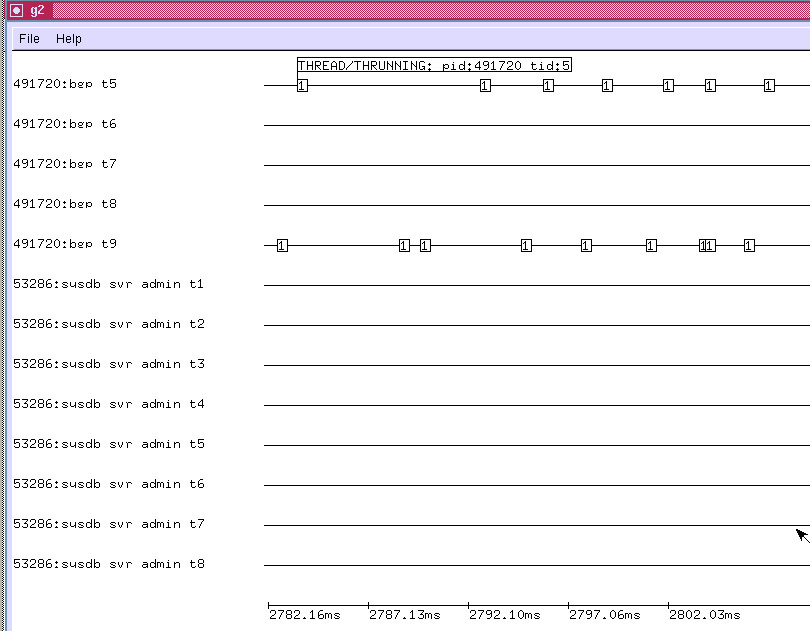
Event chasing sorts the trace axis by occurrence of the last selected event. For example, if one selects an event which means "thread running on the CPU" the first N displayed traces will be the first M threads to run (N <= M; a thread may run more than once. This feature addresses analytic problems caused by the finite size of the drawing area.
In standard (NoChaseEvent) mode, it looks like only BGP threads 5 and 9 are active:
After pressing the ChaseEvent button, we see a different picture:
Burying Boring Tracks
The sequence <ctrl><left-mouse-click> moves the track under the mouse to the end of the set of tracks, effectively burying it. The sequence <shift><left-mouse-click> moves the track under the mouse to the beginning of the set of tracks. The latter function probably isn't precisely right--I think we may eventually provide an "undo" stack to provide precise thread exhumation.
Summary Mode
Summary mode declutters the screen by rendering events as short vertical line segments instead of numbered boxes. Event detail display is unaffected. G2 starts in summary mode, zoomed out sufficiently for all events in the trace to be displayed. Given a large number of events, summary mode reduces initial screen-paint time to a tolerable value. Once you've zoomed in sufficiently, type "e" - enter event mode, to enable boxed numeric event display.
Hotkeys
G2 supports the following hotkey actions, supposedly (circa 1996) Quake-like according to the feature's original author:
